EASE OF LIVING INDEX
IN NEWS
Three cities in Maharashtra — Pune, Navi Mumbai and Greater Mumbai — top the first Ease of Living Index brought out by the Union Ministry of Housing and Urban Affairs. The national capital, New Delhi, is ranked 65 among 111 cities, while Chennai is in 14th place. Kolkata did not participate in the survey.
EASE OF LIVING INDEX
The Ease of Living Index is an initiative of the Ministry of Housing and Urban Affairs (MoHUA) to help cities assess their liveability vis-à-vis global and national benchmarks and encourage cities to move towards an ‘outcome-based’ approach to urban planning and management. It was decided in June 2017 to rank cities based on the liveability parameters. The implementation of the assessment commenced formally on 19 January, 2018 covering 111 cities.
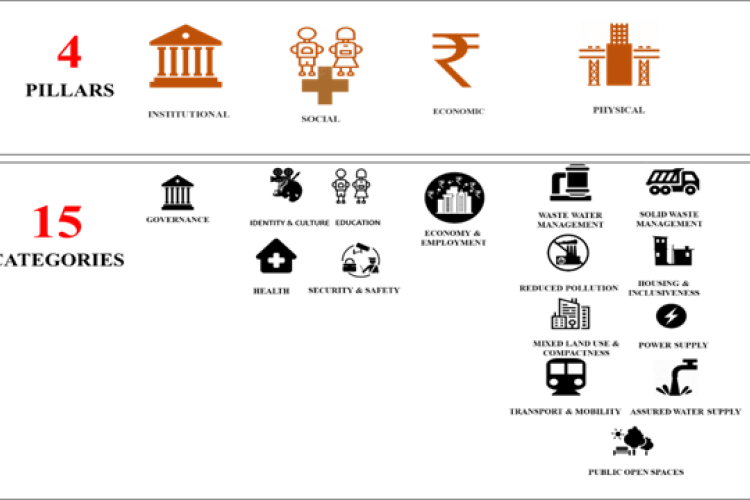
Ease of Living framework comprises four pillars namely Institutional, Social, Economic and Physical which are further broken down into 15 categories and 78 indicators.
Indicators for Evaluation
It has been done on a 100-point scale across the 78 indicators with four pillars
- 25 points for institutional pillar
- 25 points for social pillars
- 5 points for economic pillar
- 45 points for the physical pillar.
The whole exercise is being carried out on a mass scale and began with a National Orientation Workshop to orient city officials on assessment framework. It was followed by 33 state level workshops spread across all 36 states and Union Territories.
A data entry portal and a monitoring dashboard for real time update on progress was established. Apart from presenting the overall national ranking of 111 cities, the dashboard will present ranking of the cities across pillars, category, geographical zone and population classifications.
Four classifications of cities based on population include:
Classification 1- Cities with population of 4 million and above;
Classification 2: Cities with population greater than1 million but less than 4 million;
Classification 3: Cities with population greater 0.5 million but less than 1 million; and
Classification 4: Cities with population less than 0.5 million).
The dashboard will also have a comparison feature that will allow users to analyse the performance across cities on various liveability parameters.
Data deficient
For example, New Delhi has a score of “zero” on indicators regarding inclusive housing and mixed land use and compactness, and a score of just 0.12 on economy and employment.
This does not mean that the capital actually performs so poorly on these indicators, according to members of the consortium which carried out the survey and produced the Index for the government. Instead, it probably means that the NDMC and the three Municipal Corporations which govern the city simply failed to provide any data on those indicators.
UTILITY OF THE INDEX
The Ease of Living assessment standards are closely linked to the Sustainable Development Goals (SDGs) and will provide a strong impetus to India’s effort for systematic tracking progress of SDGs in the urban areas. Of the 17 SDG goals, 8 goals are directly linked to India’s ease of living assessment framework with SDG 11 that is aimed at making our cities and human settlements inclusive, safe, resilient and sustainable being measured through a set of 30 indicators.
Ranking: Ease of Living Index
|
Top ten cities |
|
|
|
|
|
|
|
|
|
|
Pillar Wise: Top ten cities
|
Institutional |
Social |
Economic |
Physical |
|
|
|
|
|
|
|
|
|
|
|
|
|
|
|
|
|
|
|
|
|
|
|
|
|
|
|
|
|
|
|
|
|
|
|
|
|
|
|
|
City Population Typology wise : Top three cities
|
Population ≥ 4 million |
Population ≥ 1 million < 4 million |
Population ≥ 0.5 million < 1 million |
Population les than 0.5 million |
|
Greater Mumbai |
Pune |
Chandigarh |
Tirupati |
|
Chennai |
Navi Mumbai |
Tiruchirappalli |
Karimnagar |
|
Surat |
Thane |
Amravati |
Bilaspur |

 IAS -2025 Prelims Combined Mains Batch - Starts on - 13-05-2024